
Gantt Till You Can’t
Or Don’t, Do Whatever You Want

Where was I: Oh right. Sorry, I got distracted by Valentine’s Day. I was thinking I wanted to write a Shelf Life about dogs. Dogs in literature. Did you know Virginia Woolf wrote a novel from the perspective of Elizabeth Barrett Browning’s dog (Flush)? This is my second-favorite Virginia Woolf novel, after the one about an immortal trans gal (Orlando). If I wrote a book from the perspective of either of my dogs, it would be very boring. They mostly sleep. Most dogs mostly sleep, I think. This is also why my autobiography would be boring (I mostly sleep).
In Tuesday’s Shelf Life I talked a bit about the triple constraint principle of project management, and that reminded me that I had another project management–related Shelf Life on the to-write list. Or, kind of. To be more specific, I had another Shelf Life on the to-write list that borrows a tool or principle from project management and applies it to writing (in this case, plotting).
This is something I do from time to time because, although I characterize myself as an editor by trade—and I have been, and that is a skillset I have—I’ve been in publishing operations management and publishing project management on and off for a long time, between more hands-on editing kinds of jobs. I have a lot of project- and operations-management skills from this. One of those is project planning.
This brings me to why I’m covering Gantt charts today. They are a project-planning tool that can be used for planning out writing projects as well as for anything else. The “Gantt” in Gantt chart is always capitalized because it’s from a person’s name (the person who invented the chart, I imagine).
Here’s your real writing tip of the day: Have some words that always need to be capitalized even though they sound like generic nouns—because they are actually trade names: Dumpster, Fiberglass, Realtor, Popsicle. Also Velcro, but nobody knows what you mean when you say “hook and loop closure” so you should just say Velcro or the lady at Joann is not going to find you what you need.
Gantt chart is kind of like the trade name for bar chart. Not really, though. Like similes are to metaphors, Gantt charts are to bar charts. Gantt charts are a type of bar chart. I don’t actually have that much to say about Gantt charts, which is why I picked this for today’s topic. I intend this to be a short, concise Shelf Life that is soon over so I may get (back) to sleep. Let’s see if I can honor this intention.
A Gantt chart is a bar chart typically used to visualize a schedule, with each bar representing the duration of a task. The horizontal span or X axis of your chart is the passage of time which might be measured in days, weeks, months, (hours?) or whatever unit of time makes sense for the scope of the project. Your Y axis rows are your tasks—in a classic Gantt, but we’re going to talk about some modifications for novel/story planning. Each row is a task in your project.
A Gantt chart is really good at helping plan out the schedule for project tasks taking into account their dependencies. For instance: Let’s say I need 180 days to write a novel, my editor needs 90 days to copyedit it, my compositor needs 14 days to typeset it, and my proofreader needs 14 days to proofread it. That means my novel will ostensibly take 298 days from when I start writing to when the proofread is complete. The Gantt chart might look like this:

However, not all of these tasks are dependent upon the prior task being fully completed before they may start. If I am writing a book that is 10 equal-sized chapters long, perhaps I write a chapter in 18 days, my copyeditor needs 9 days with it. The editor can be working on chapter 1 while I write chapter 2. We can overlap the copyediting time with the writing time, and then hand the whole thing off to comp when it’s done editing. Now my Gantt chart looks like this:

Instead of wrapping up proofreading at the beginning of Q2 2024, we’re now finishing everything up mid-Q4 2023. (I used the OnlineGantt to make these quickly in my web browser.) I don’t recommend working on books like this, by the way. But I’ve done it when someone really needed to make a deadline.
In this instance, we have some tasks that are dependent upon the previous one finishing—for instance, comp relies on editing being finished and proofing requires comp to be finished. And we have one task—copyediting—that is dependent upon the prior task (writing) to be started but not finished, in this case with an offset of 18 days (the number of days it takes the author in this thought exercise to write one chapter).
In the real world, you can get compositors and proofreaders to work on a partial manuscript but in my opinion the risk (of something getting messed up or missed) isn’t worth the reward (of the time savings) given their work happens pretty fast anyway. That’s neither here nor there.
If you were a person who wrote a lot of manuscripts and flowed them all through an editorial and production process like this—for instance, if you wrote and self-published a pipeline of content, as many authors do—you might find a Gantt chart very helpful to map out the flow of content through the pipeline.
As you get more in-depth with Gantt charts you can add resources to and assign tasks to them. For instance, if Jane is your favorite cover designer and Catherine is your favorite copyeditor (I am, right?) and John is your favorite proofreader, you could use a Gantt chart to map out when those folks are available to work on which projects. If Jane needs 10 business days to do a cover, you can’t send her two covers at once and get them back in 10 business days. The resource that is “Jane” will need to be reserved for two consecutive tasks, one after another, for 20 business days total. If you really need two covers back in 10 business days, you’ll have to bring in another cover design resource.
So that’s all really cool, and I highly recommend this when you’re planning a project with a lot of dependencies, resources, and tasks. Try planning a gala or a building construction without a Gantt chart. You might find you . . . gannott do it.
A fun fact about today’s Shelf Life is that it experienced scope creep when I added a section about critical path analysis and then, to reduce the time it would take to write, eliminated a feature—the extra parts, that you didn’t really need, about critical path—and reduced the scope of the project back to what was originally planned. Anyway.
A complex story like a novel or a series of novels is like a project. I mean, writing it is a project, yes. But in this case I mean the plot of the novel (or series) is also like a project. It has:
Plot points, which are like tasks
Characters, which are your resources
Project duration, which is the story from beginning to end
A plot is a series of actions that move your story forward. Characters are required to carry out those actions. Some actions that make up the plot can happen simultaneously, while others depend upon a prior plot point to finish before they can begin.
Consider The Lord of the Rings:
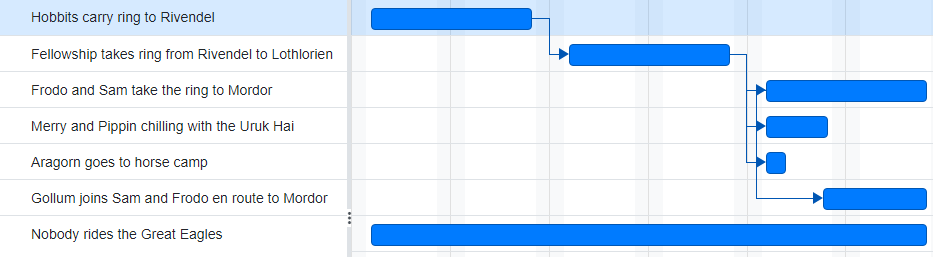
At the outset, everyone who is doing anything important is together (Frodo, Sam, Merry, Pippin, and later Aragorn). I mean, Gandalf is doing important stuff but it’s not recounted in the story and I’m not making a Gantt chart of the Book of Lost Tales because, to reiterate, I’m trying to stay in scope and go to bed someday.
But anyway, once the Fellowship breaks up after Lothlorien there’s a bunch of stuff going on with different, shifting groups of people. You have Sam and Frodo going to Mordor, Merry and Pippin’s kidnapping, escape, and time with the Ents, the business with Aragorn, Gimli, and Legolas at Edoras and Helm’s Deep. They add characters to their party of adventurers (Gandalf, Eowyn, Gollum) and then the groups change configuration. First Merry and Pippin are together, then Merry is with Eowyn and Pippin is with Gandalf. Everybody’s all over the place.
Some of these plot points are independent of one another. Sam and Frodo’s journey through Mordor is not affected by Aragorn, Gimli, Legolas, and Gandalf’s endeavors at Helm’s Deep.
Some of these plot points are dependent upon one another. For instance, the Rohirrim are busy defending the siege at Helm’s Deep and cannot go to Gondor until after they have completed that task. Taking the Rohan forces to Gondor depends upon the completion of the Helm’s Deep task.
There are two ways I use Gantt-style charts for keeping track of big projects with large casts of characters and complex, overlapping plots and subplots.
For both methods, the X axis of my chart is the timeline of the story, which I might measure in specific units of time (days, months) but am much more likely to measure in parts of the story, like “Act 1, 2, 3” or “Chapter 1, 2, 3,” and so on.
The Y axis of my chart might be broken down by plot point or by character. For a story that is Lord of the Rings– or Game of Thrones–esque with many different character groups in different locations doing different things, it makes more sense for me to track it by those groups. “Group A who are in Place X,” “Group B who are in Place Y,” and “Group C who are in Place Z,” for instance. Rather than one plot point per row, a row might have many plot points along the course of the X axis, which could be back to back or might have empty time between them when those characters are not doing anything the manuscript is recording.

Alternately, still keeping the same X axis, I might record the Y axis rows as individual plot points grouped together by main plot and subplot, like this:

I have found this to be particularly helpful when mapping out character arcs over a long story or even multiple stories set in the same series or “world.” Plot is a catalyst for character growth, so I can use this as a tool to map out character growth and development across a long and winding plot.
It’s not unusual for me to know, before I’ve figured the plot out, how a character will grow and develop. A character who has difficulty relying on others will ultimately learn to rely on someone else, for instance. But I might not know, at the outset, what will happen with the plot to make that character change and grow. The Gantt chart can be very helpful for mapping the character’s development arc to the events of the plot as I figure them out.
Anyway, I hope looking at these neat graphics was as fun for you as making them was for me. Today’s Shelf Life is right on target vis a vis the word budget I had in mind—unless you count a picture as a thousand words in which case I am 5,000 words over, so had better hurry up and sign off.
If you have questions that you'd like to see answered in Shelf Life, ideas for topics that you'd like to explore, or feedback on the newsletter, please feel free to contact me. I would love to hear from you.
For more information about who I am, what I do, and, most important, what my dog looks like, please visit my website.
After you have read a few posts, if you find that you're enjoying Shelf Life, please recommend it to your word-oriented friends.